If you just launched a website and want to know how it’s performing on Google — Google Search Console (GSC) is the very first tool you need to set up. It’s free, it’s directly from Google, and it gives you data no third-party tool can replicate.
At ZenvySEO, we recommend GSC to every website owner regardless of experience level. Whether you’re a blogger, a small business owner, or a marketer starting out — this guide will walk you through every key feature of Google Search Console in plain, practical terms.
What Is Google Search Console?
Google Search Console is a free web service provided by Google that lets you monitor, maintain, and troubleshoot your website’s presence in Google Search results. It was previously called Google Webmaster Tools before being rebranded in 2015.
In simple terms, it’s your direct line of communication with Google. It shows you:
- Which keywords are bringing people to your site
- How many times your pages appear in search results (impressions)
- Whether Google can crawl and index your pages properly
- Any technical issues that could hurt your rankings
- Your backlink profile from other websites
Think of it like a health dashboard for your website’s search performance. Without it, you’re essentially flying blind.
How to Set Up Google Search Console
Getting started takes less than 10 minutes. Here’s how:
- Go to search.google.com/search-console
- Sign in with your Google account
- Click “Add Property”
- Choose your property type (more on this below)
- Verify ownership of your site
Choosing Your Property Type
When adding a new property, GSC gives you two options:
| Property Type | What It Covers | Best For |
| Domain | All URLs across all subdomains (http, https, www) | Most website owners |
| URL Prefix | Only the exact URL you enter | Specific subdomains or subdirectories |
For most people, the Domain property is the better choice. It captures all traffic data in one place, no matter if someone visits http:// or https:// or www. versions of your site.
Ownership Verification
Before you can access any data, Google needs to confirm you actually own the site. There are several verification methods:
- DNS record — Add a TXT record to your domain registrar (recommended for Domain properties)
- HTML file upload — Download a file from GSC and upload it to your website’s root folder
- HTML tag — Add a meta tag to your homepage’s <head> section
- Google Analytics — If GA is already set up with the same Google account
- Google Tag Manager — If GTM is active on your site
Pro tip for WordPress users: If you use the Yoast SEO plugin, paste the HTML tag verification code directly into SEO → General → Webmaster Tools and you’re done in under a minute.
Users, Owners, and Permissions
Once GSC is set up, you can share access with teammates or clients. There are three permission levels:
| Role | What They Can Do |
| Owner | Full access — view data, use all tools, manage permissions |
| Full User | View all data, use most tools — cannot manage permissions |
| Restricted User | Can view most reports — cannot use URL inspection or change settings |
If you’re an agency or freelancer, always add your clients as owners so they retain access if the relationship ends. Add yourself as a Delegated Owner.
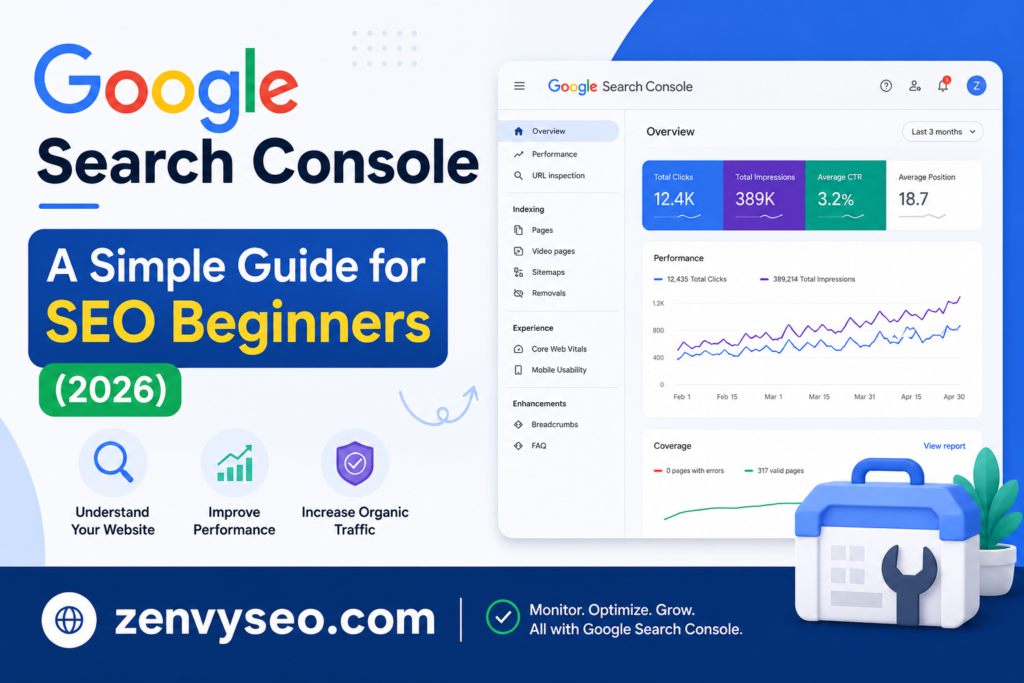
Overview Dashboard
When you log in to GSC, the Overview page is the first thing you’ll see. It gives a quick snapshot of:
- Performance (clicks and impressions over the last 3 months)
- Page indexing status
- Any experience issues (Core Web Vitals, mobile usability)
- Manual actions or security issues (if any)
This is your starting point before diving into individual reports. Check it regularly — if something goes wrong, GSC often surfaces alerts here first.

Performance Report
The Performance report is the most used section of Google Search Console, and for good reason. It shows how your site performs across Google Search, Google Discover, and Google News.
The four core metrics are:
- Total Clicks — How many times users clicked through to your site from search
- Total Impressions — How many times your URLs appeared in search results
- Average CTR — Click-through rate: the percentage of impressions that turned into clicks
- Average Position — Your average ranking position across all tracked queries
You can filter this data by Query, Page, Country, Device, and Date, which is where it gets really powerful for SEO analysis.
3 Quick Tips to Get More Organic Traffic with the Performance Report
At ZenvySEO, we use these techniques regularly to find quick wins for our clients. Try them yourself:
TIP #1: Find Pages That Need CTR Optimization
Some pages rank well (positions 1–10) but still get very few clicks. This usually means the title tag or meta description isn’t compelling enough.
How to find these pages:
- Open the Performance report
- Click on the Pages tab
- Enable Average CTR and Average Position
- Sort by Average Position (ascending)
- Look for pages in positions 1–10 with a CTR below 3–5%
Those are your quick wins. Rewrite the title and meta description to be more benefit-driven and click-worthy. Even a small CTR improvement on a high-impression page can significantly increase traffic without changing your ranking.
TIP #2: Find New Keywords to Optimize For
GSC reveals keywords you’re already ranking for — many of which you may not even know about.
How to do it:
- Go to the Queries tab in the Performance report
- Filter by pages with impressions but low clicks
- Look for relevant keywords where you rank on page 2 (positions 11–20)
These are your “striking distance” keywords. You’re close — a small optimization push (adding those keywords to your H2s, content body, or updating your page) can move them onto page 1 and unlock a wave of new traffic.
TIP #3: Identify Pages Competing for the Same Keyword
This is called keyword cannibalization — when two or more of your pages compete for the same query. It dilutes your ranking power.
How to find it:
- In the Queries tab, search for a target keyword
- Click on it, then switch to the Pages tab
- If multiple URLs appear for the same query, you have cannibalization
The fix: consolidate the weaker page into the stronger one, or clearly differentiate them by intent.
TIP #4: Import Keywords from GSC to SERPWatcher
If you use a rank tracking tool like SERPWatcher by Mangools, you can import your top-performing GSC keywords directly.
This lets you track ranking changes over time and correlate them with content or technical changes you make — giving you a much clearer picture of what’s actually working.
Page Indexing Report
Previously called the “Coverage Report,” the Page Indexing report shows you which pages Google has indexed and which ones it hasn’t — and why.
Pages are grouped into four statuses:
| Status | Meaning |
| Valid | Page is indexed and eligible to appear in search |
| Valid with warning | Indexed but has a potential issue |
| Error | Not indexed due to a problem |
| Excluded | Not indexed intentionally (noindex, duplicate, etc.) |
Common errors to fix right away include 404 pages, server errors (5xx), redirect errors, and pages blocked by robots.txt. If important pages show up as “Discovered – currently not indexed,” use the URL Inspection Tool to request indexing manually.

Sitemaps
An XML sitemap is essentially a map you hand to Google, saying “here are all the pages I want you to know about.” Submitting one in GSC speeds up crawling and indexing.
How to submit a sitemap:
- Go to Indexing → Sitemaps in the left menu
- Enter your sitemap URL (usually yourdomain.com/sitemap.xml)
- Click Submit
Most SEO plugins (Yoast, Rank Math, AIOSEO) generate your sitemap automatically. GSC will then show you how many pages were submitted vs. how many were indexed — a discrepancy here is worth investigating.
Enhancements
The Enhancements section includes reports related to features that can improve how your pages look in search results. This includes:
Mobile Usability Report
Google uses mobile-first indexing, meaning it primarily evaluates the mobile version of your site. The Mobile Usability report flags issues like:
- Text too small to read
- Clickable elements too close together
- Viewport not configured correctly
Fix these issues to improve both user experience and search rankings.
AMP Report
If your site uses Accelerated Mobile Pages (AMP), this report shows whether your AMP pages are valid. Invalid AMP pages can’t appear in AMP-specific features in search. If you’re not using AMP, you can ignore this section.
Structured Data Report
Structured data (also called Schema markup) helps Google understand your content more deeply and can trigger rich results — like star ratings, FAQ dropdowns, recipe cards, and event listings — in search.
The Structured Data report shows:
- Which schema types Google detected on your site
- Any errors or warnings with your markup
- Whether your pages are eligible for rich results
Fixing structured data errors can improve your click-through rates dramatically since rich results stand out visually in the SERPs.
Manual Actions Report
A manual action is a penalty applied by a Google reviewer when your site violates Google’s spam policies. This is different from an algorithmic penalty.
Common reasons for manual actions include:
- Unnatural inbound or outbound links
- Thin, low-quality, or duplicate content
- Cloaking or sneaky redirects
- User-generated spam
If you have a manual action, it will show up clearly in this report under Security & Manual Actions → Manual Actions. You’ll need to fix the underlying issue and submit a reconsideration request through GSC for the penalty to be lifted.
Most websites will never see a manual action — but checking this report periodically is good hygiene.
Legacy Tools and Reports
Some older GSC features have been moved to Legacy tools and reports. These include the old URL Parameters tool, International Targeting, and Crawl Stats.
While these aren’t front-and-center anymore, international sites and technical SEOs may still find them useful for advanced configuration.
Links Report
The Links report shows your site’s backlink profile as seen by Google. It includes:
- External links — Sites linking to you, and which of your pages receive the most links
- Internal links — Which pages on your own site link to which other pages
- Top linking sites — The domains sending the most links
- Top linking text — The anchor text most commonly used to link to you
This is genuinely valuable data because it comes directly from Google’s index — not a third-party crawler’s estimate. Use it to identify your strongest pages (protect and build on them), spot any spammy linking patterns, and improve your internal linking strategy.
Conclusion
Google Search Console isn’t glamorous, but it’s one of the most powerful — and underused — SEO tools available. It gives you a direct window into how Google sees your website, and that’s something no amount of guessing or third-party tooling can replace.
At ZenvySEO, our advice is simple: set it up today, check it at least once a month, and use the Performance report weekly to find opportunities. Start with the quick wins — CTR optimization, striking distance keywords, and fixing indexed pages — and you’ll see real results without spending a single dollar.
Frequently Asked Questions (FAQs)
Is Google Search Console free to use?
Yes, Google Search Console is completely free for anyone with a Google account and a website.
How long does it take for data to appear in GSC after setup?
It typically takes 24–72 hours for initial data to populate after you verify ownership.
What’s the difference between Google Search Console and Google Analytics?
GSC shows how your site performs in Google Search (impressions, clicks, rankings). Google Analytics shows what visitors do once they’re on your site (sessions, bounce rate, conversions).
Can I add multiple websites to one GSC account?
Yes, you can add and manage as many properties (websites) as you need under a single Google account.
What does “Crawled – currently not indexed” mean?
It means Google visited the page but decided not to add it to the index. This could be due to thin content, duplicate content, or quality issues. Review the page content and improve it.